Foodland maintains customer satisfaction ratings lead

New customer satisfaction data from Roy Morgan shows Foodland is the winner of September’s Supermarket of the Month Award, with a customer satisfaction rating of 88%. Supermarket giants Coles and Woolworths placed equal second and equal fourth respectively.
The Roy Morgan Supermarket Customer Satisfaction Report shows Foodland at the top of the satisfaction ratings ahead of Coles (82%), IGA (82%), Aldi (81%) and Woolworths (81%).
September’s ratings were obtained from the Roy Morgan Single Source survey, which is compiled from in-depth face-to-face interviews with around 50,000 Australians each year in their homes.
Roy Morgan CEO Michele Levine says that Foodland’s unbeaten run throughout 2019 is a significant feat in an increasingly competitive market: “Foodland has now won 15 monthly satisfaction awards in a row, and given it is 6% ahead of next placed Coles and IGA, it appears as though its winning streak is set to continue. Foodland is certainly giving people what they want from a supermarket.“
The company began in South Australia and now operates over 100 stores there, as well as one in New South Wales and another in Northern Territory. It maintains an ethos of sourcing South Australian products wherever possible, and supports a number of local sporting clubs and charities. These factors are likely contributing to Foodland’s ongoing popularity with local communities,” Ms. Levine said.
Leading supermarket customer satisfaction ratings
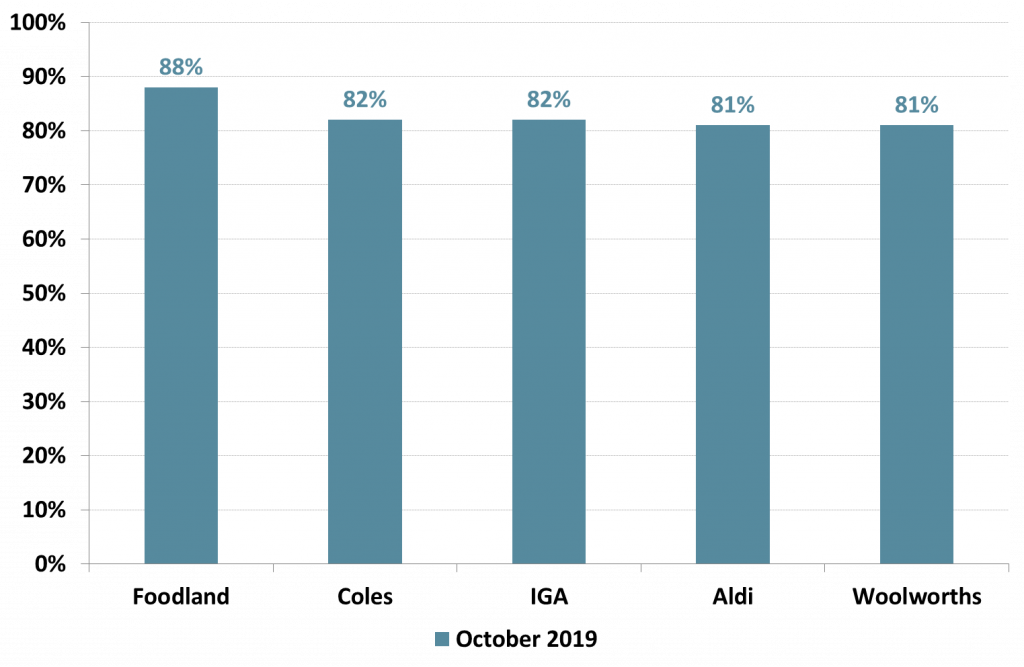
Source: Roy Morgan Single Source Australia, May - Oct. 2019, n= 5,586. Base: Australians 14+ who are the main grocery buyer.
While Coles (82%) maintains a slight lead over Woolworths (81%) in overall customer satisfaction, the data for individual fresh produce categories shows just how close the satisfaction ratings are for both brands across a range of products.
Coles achieves greater satisfaction ratings in bread while Woolworths was the marginally better performer in dairy, deli and seafood and has a larger advantage for meat. The two supermarket leaders couldn’t be separated with equal satisfaction for their fresh fruit and fresh vegetable offerings.
“Australians are seeing increasing competition in supermarkets, especially from low-cost alternatives such as Aldi, and the soon to arrive German giant Kaufland. However, the market is still dominated by Coles and Woolworths, who continue to battle across product categories,” Ms. Levine said.
Coles and Woolworths fresh produce category customer satisfaction ratings

Source: Roy Morgan Single Source Australia, May - Oct. 2019, n= 5,586. Base: Australians 14+ who are the main grocery buyer.
Roy Morgan Customer Satisfaction Awards
While the Roy Morgan Customer Satisfaction Awards focus on satisfaction ratings, there is far more in-depth data available. Roy Morgan tracks a huge range of variables including customer satisfaction, engagement, loyalty, advocacy and NPS across a wide range of industries and brands. This data can be analysed by month for your brand, and importantly, your competitive set. Detailed data and analysis are included in the Roy Morgan Supermarket Customer Satisfaction Report.
Check out the new Roy Morgan Customer Satisfaction Dashboard at https://www.customersatisfactionawards.com.
For comments or more information please contact:
Roy Morgan - Enquiries
Office: +61 (03) 9224 5309
askroymorgan@roymorgan.com
Margin of Error
The margin of error to be allowed for in any estimate depends mainly on the number of interviews on which it is based. Margin of error gives indications of the likely range within which estimates would be 95% likely to fall, expressed as the number of percentage points above or below the actual estimate. Allowance for design effects (such as stratification and weighting) should be made as appropriate.
| Sample Size | Percentage Estimate |
| 40% – 60% | 25% or 75% | 10% or 90% | 5% or 95% | |
| 1,000 | ±3.0 | ±2.7 | ±1.9 | ±1.3 |
| 5,000 | ±1.4 | ±1.2 | ±0.8 | ±0.6 |
| 7,500 | ±1.1 | ±1.0 | ±0.7 | ±0.5 |
| 10,000 | ±1.0 | ±0.9 | ±0.6 | ±0.4 |
| 20,000 | ±0.7 | ±0.6 | ±0.4 | ±0.3 |
| 50,000 | ±0.4 | ±0.4 | ±0.3 | ±0.2 |